Stock Market
in 2024 / 2025
Cyclical analysis of the stock market to identify patterns in price movements.
Hi there! Want to support my work?
In this research, we will attempt to identify temporal patterns in the fluctuations of the Dollar Index over the past several years. Additionally, we will endeavor to forecast the movement of the index for the upcoming year, 2024.
The Kitchin Cycle
The Kitchin Cycle, also known as the inventory or business inventory cycle, is a short-term economic cycle lasting approximately 3 to 4 years. Named after economist Joseph Kitchin, who first described it in 1923, this cycle is characterized by fluctuations in business inventories, reflecting changes in production and consumption patterns.
Let's imagine that the economy is like an ocean, where tides represent changes in business cycles. The Kitchin Cycle can be likened to the ebb and flow that occurs every 40 months.
Flow (Expansion): When things are going well, companies actively produce goods, expand their operations, and everything seems prosperous. This is akin to the flow, where the water rises, and everything is on the upswing.
Overproduction: Over time, the market becomes saturated with goods, much like water encroaching on the shore. The quantity of produced goods becomes too much for demand, and companies start cutting back on production.
Ebb (Contraction): Demand drops, prices decrease, and goods remain unsold, similar to water receding during the ebb. Companies realize the urgent need to reduce production.
Temporal Delays: It's crucial to note that companies require time to make decisions, similar to the ocean responding to tide changes with some delay. These temporal delays create periodic fluctuations in the economy, shaping the Kitchin Cycle.
Just as tides are a natural part of the ocean's cyclical nature, the Kitchin Cycle is an integral part of economic life. It's important to recognize that after a period of production cutbacks comes a new phase of increased demand, prices, and production.
Thus, the Kitchin Cycle is a kind of rhythm ingrained in economic life, manifesting in periodic changes in production and demand for goods and services.
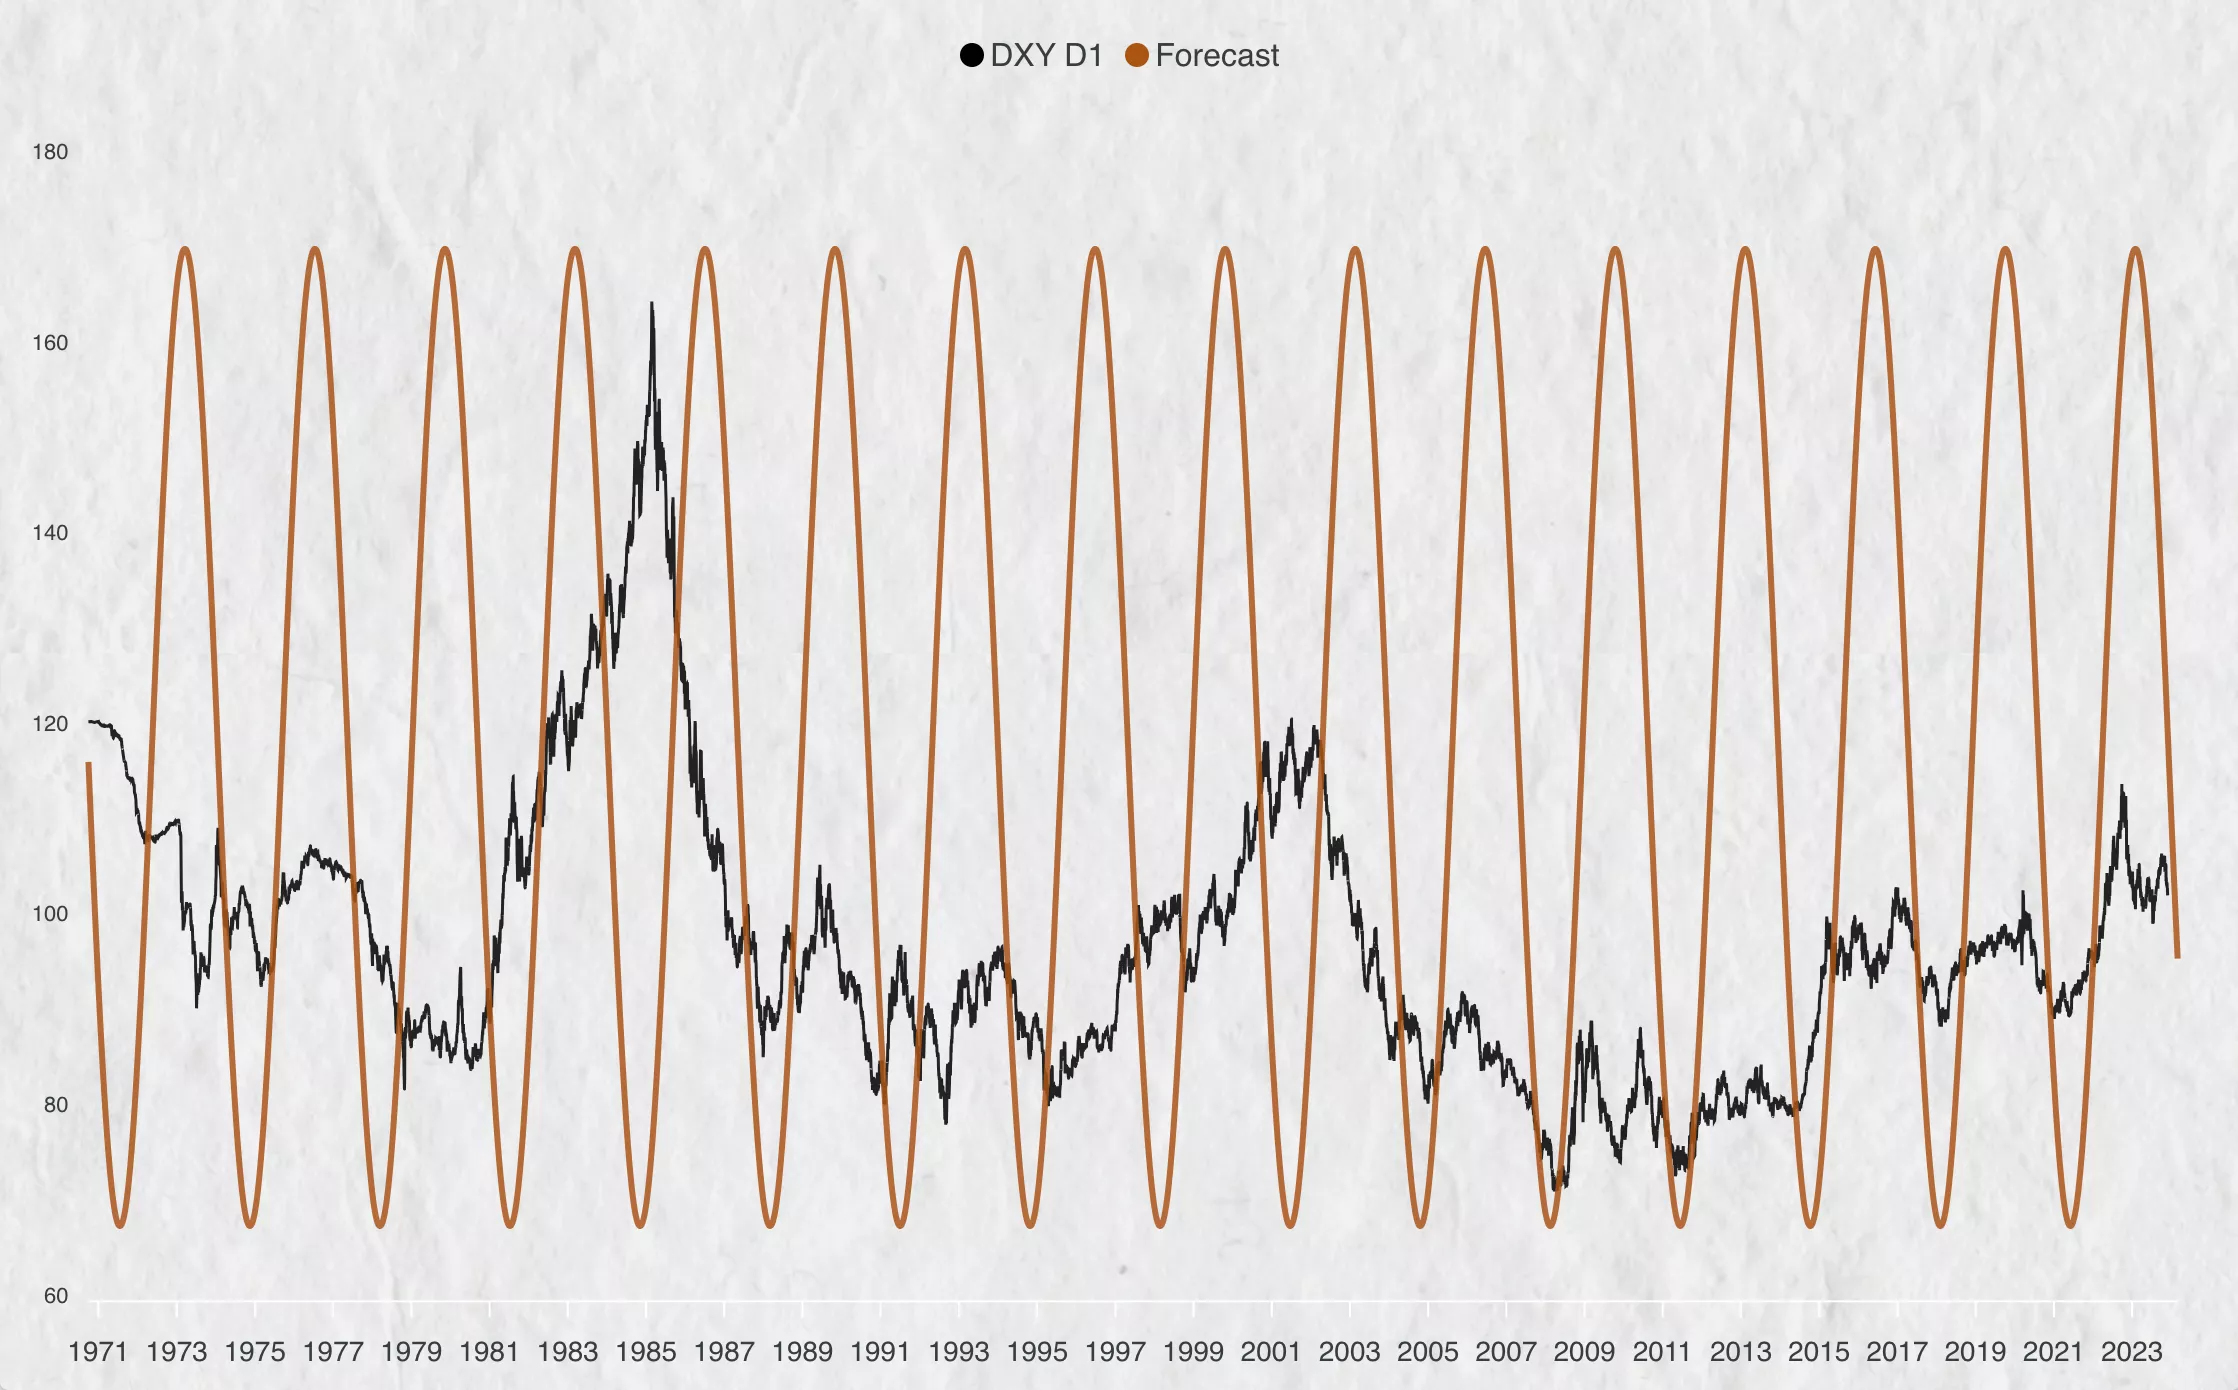
50 Years of DXY: The 40-Month Kitchin Cycle
Let's delve into and visually illustrate the 40-month Kitchin Cycle on the daily chart of the Dollar Index (DXY) over the past 50 years.
Condensing half a century of history into a single chart presented its challenges, but it provides a comprehensive view of how the Kitchin Cycle has manifested over time.
In the subsequent sections, we will zoom in on this cycle within shorter time frames, offering a closer examination of its dynamics.
Charting 40 Months Since 1998
Now, let's take a closer look at this 40-month cycle starting from 1998.
As depicted in the chart below, the period from 2000 to 2002 appears to exhibit an inversion, a phenomenon I typically strive to avoid in forecasting. However, it's essential to note that in this study, we are examining a singular cycle, not a composite of 3-5 cycles that could account for almost any market oscillations.
Cycle Basics: Key Takeaways
For those unfamiliar with cycles, it's crucial to grasp three key points:
A cycle or sinus wave on the chart only reflects phases of price changes. This graph does not predict the specific price level the market will reach. In other words, it forecasts the timing of a potential market reversal.
The amplitude of fluctuations in the forecast line is not as critical. If you observe the forecast line reaching the top of the chart, it does not imply that the price will reach a new high. It simply indicates that the price will move upward during that timeframe.
The lows and highs on the forecast line represent not specific dates and times but rather periods.
Visualizing Kitchin's Influence on Dollar Index Since 2010
Next, we will examine the correlation of the Kitchin Cycle from the end of 2010 to the present. During this period, the cycle encompasses virtually all the price lows and highs of the Dollar Index, robustly confirming the cycle's reliability.
Subdividing the 40-Month Cycle
I usually steer clear of straightforward cycles, opting to examine not only absolute extremes but also local variations. In this context, I'll apply J. M. Hurst's methodology by subdividing our 40-month cycle into smaller periods — introducing cycles of 608 days, 406 days, and 304 days, which are later consolidated into a composite cycle.
I cannot claim to have achieved a perfect cycle, as there are evident zones that the resulting composite cycle does not cover. However, the primary goal is not to predict every single price minimum and maximum. Nevertheless, this cycle more accurately forecasts lows, such as those in 2004, 2008, 2011, 2014, 2018, and 2021.
Thus, there is a high probability that the low of 2024 will also be accurately determined.
Here are the results:
Forecasting Dollar Index: Insights into 2024 and Beyond
Given the fact that the last 6 Kitchin cycles accurately predicted preceding lows in the Dollar Index, one might infer that the next low will occur around September 19, 2024.
The more consistently a cycle aligns with price extremes, the more reliable the forecast becomes. However, it is essential not to solely rely on a single cycle; it should complement your technical analysis rather than replace it.
Update. April 25, 2024.
Closing Thoughts
In conclusion, it is crucial to emphasize that the Kitchin cycle analysis presented here represents just one of several potential cycles. There are other cycles that may also exhibit strong correlations with the market.
For any inquiries, feel free to reach out to me on Twitter @CyclicViews.
— Dimitry T.